
August 23, 2022
Looking for the latest data?
Check out our 2024 Large Employer Health Care Strategy Survey, released in August 2023.
Key Takeaways
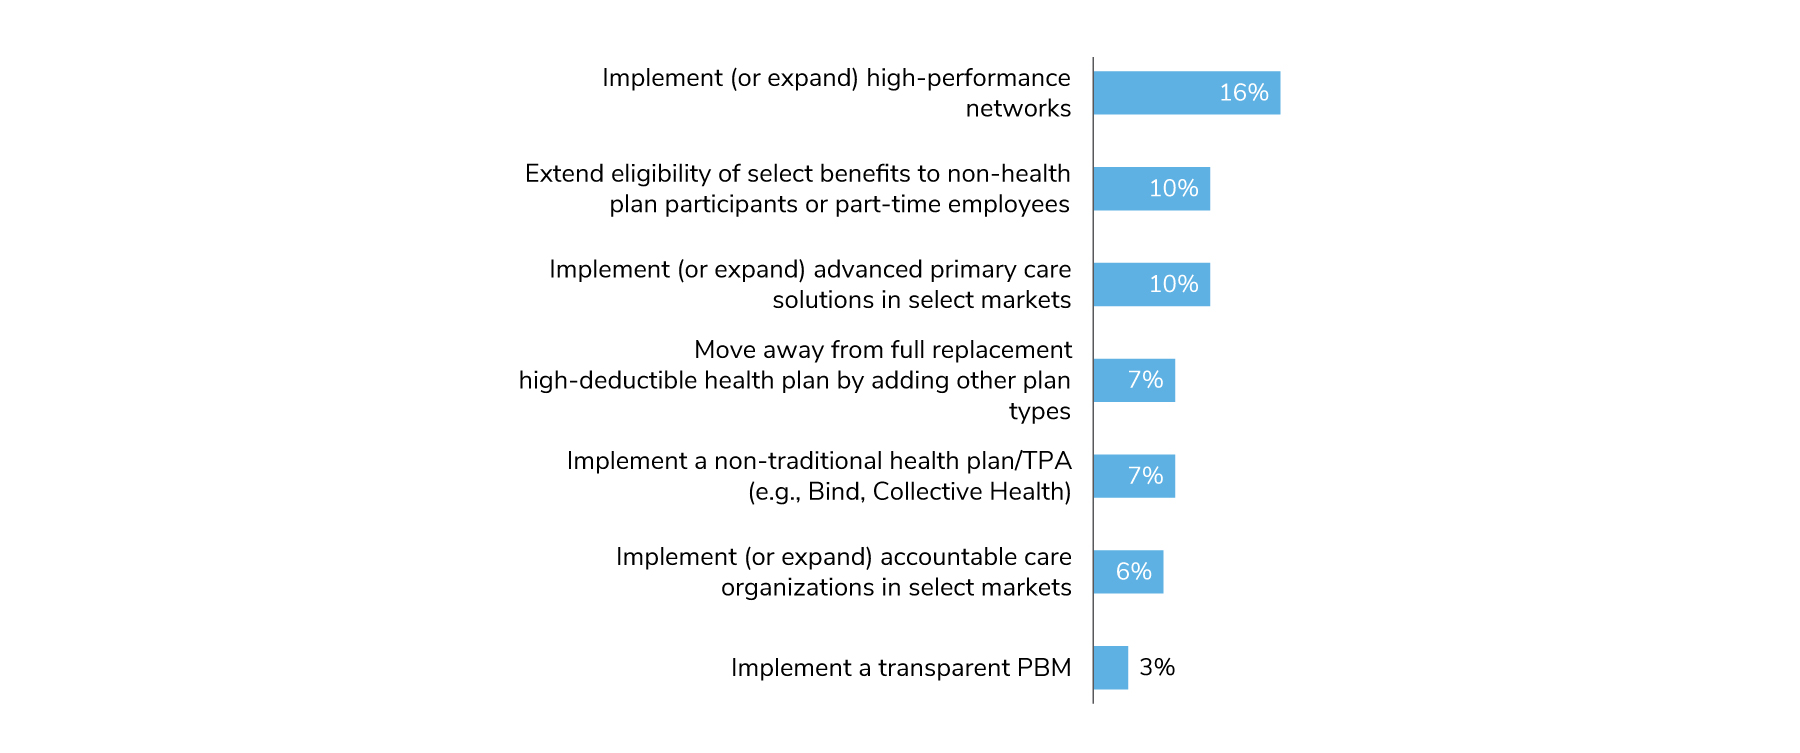
- Employers made relatively few changes to plan design, but an increase or expansion of high-performance networks is an emerging trend.
- Cost-sharing shifted in 2022, with employers taking on more of the burden of rising costs of premiums.
- While the last several years have seen a move away from full replacement and a renewed focus on more plan choice, consumer-directed health plans continue to be the highest enrolled plan.
- Prescription drug costs are 21% of overall health care spend, yet there are ample opportunities for employers to implement tactics to control it.
Although employers made few changes in plan design and eligibility in 2022, they did take on more of the cost of rising premiums. Prescription drug costs continue to rise. Concern about costs is growing, but opportunities exist to implement tactics to control them.
Few Changes in Plan Design
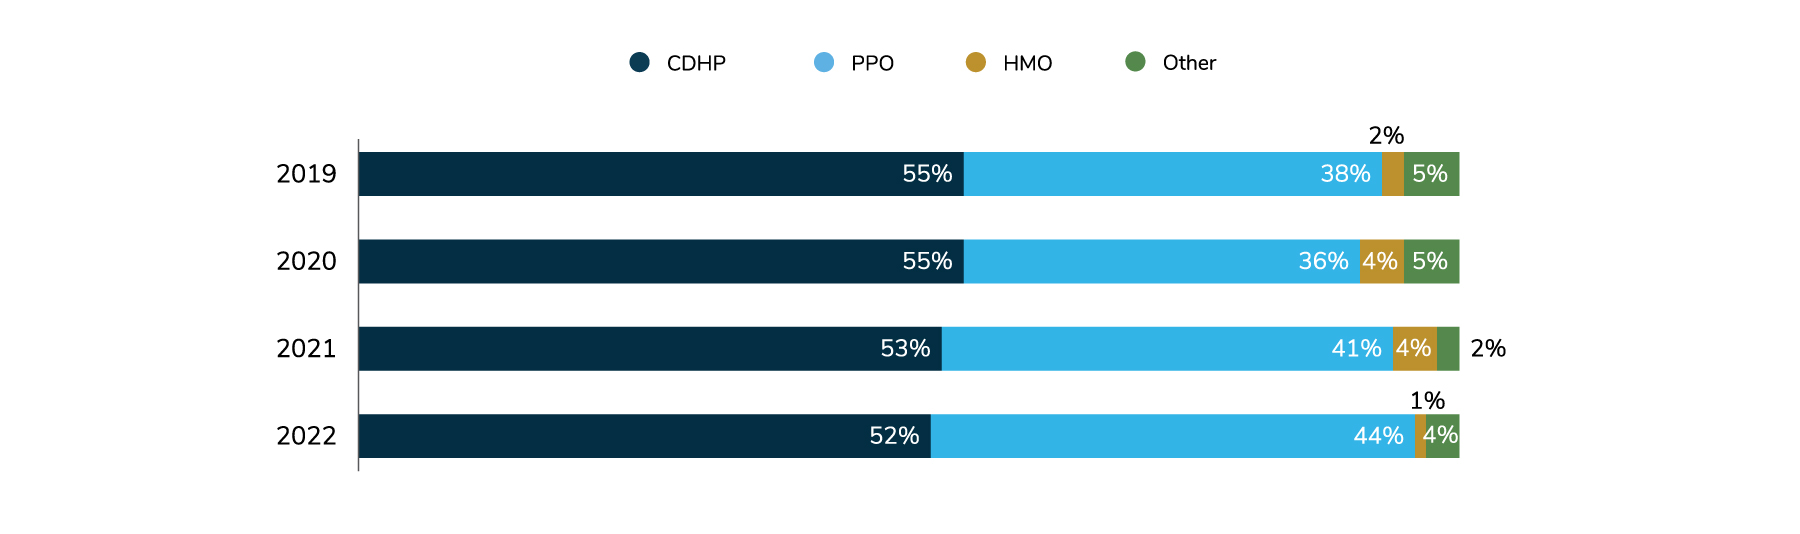
For 2023, most employers are not making any major plan design or eligibility changes (Figure 4.1). In a trend noted last year, employers are continuing to implement or expand high-performance networks (HPNs). Although consumer-directed health plans (CDHPs) continue to be the highest enrolled plans, the numbers have been slowly declining since 2019, moving from 55% to 52%. On the other hand, preferred provider organizations (PPOs) are making gains as the highest enrolled plan in the relative near future, going up from 38% in 2019 to 44% in 2022 (Figure 4.2).
CHDPS Maintain While Move Toward Plan Choice Grows
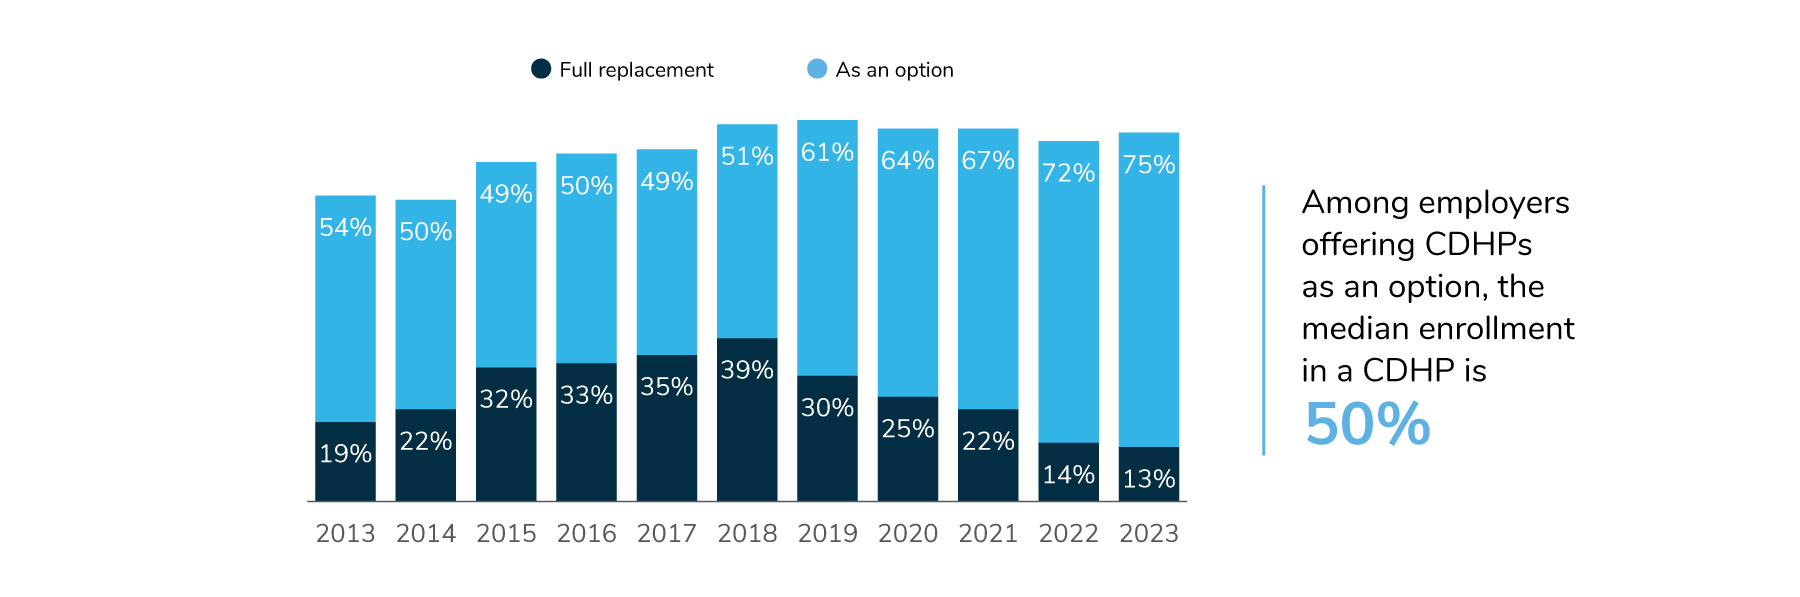
For the fifth year in a row, full replacement (i.e., CDHPs offered as the only option) has declined, while more employers are bringing choice back into their lineup. In 2023, 75% of employers will offer CDHPs as an option, up three percentage points from 2022 (72%) and eight points from 2021 (67%). The percent of employers offering full replacement declined slightly, moving from 14% in 2022 to 13% in 2023. Median enrollment in CDHPs remained the same, at 50% for the last 2 years (Figure 4.3).
Cost-sharing Arrangements
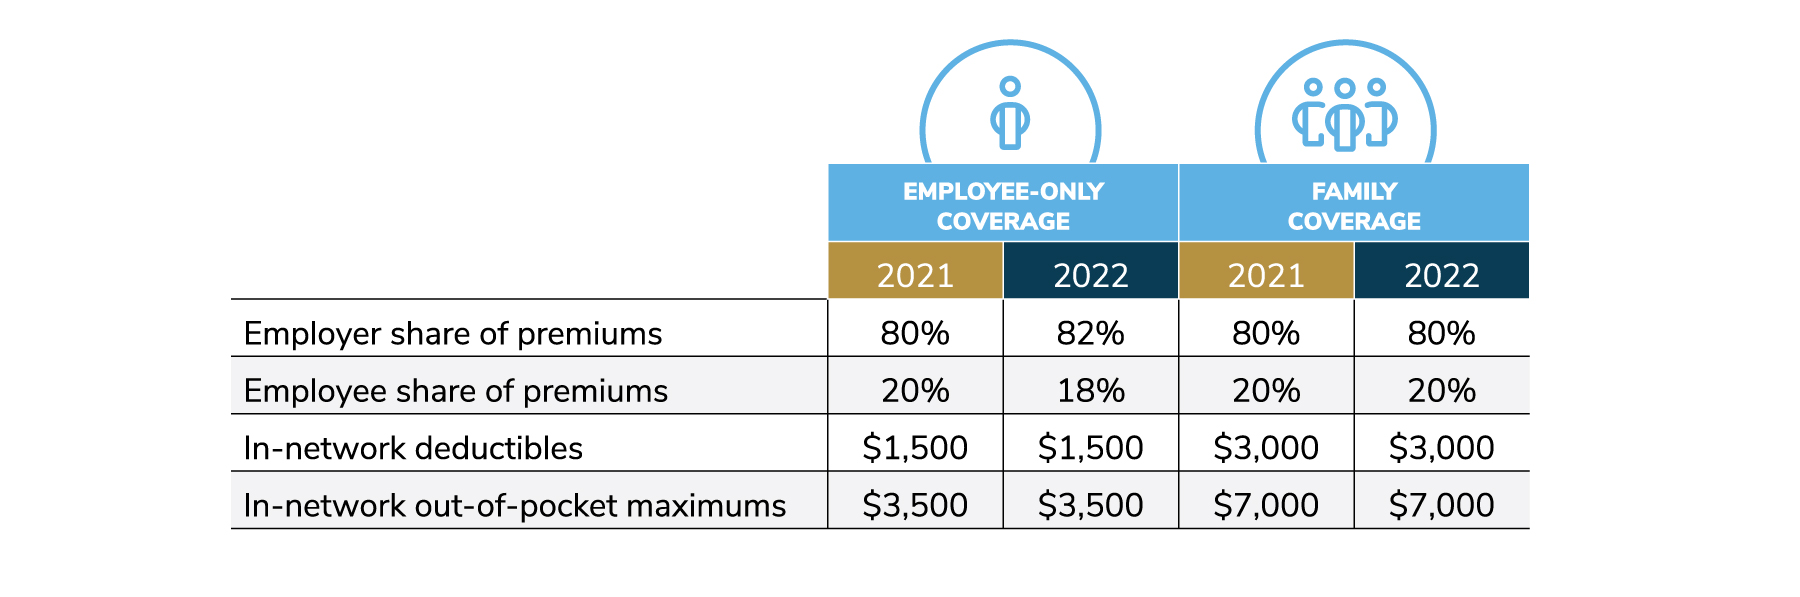
To help with the rising costs of health care, employers increased their cost sharing for premiums for employees only, from 80% to 82%. This increase covers PPOs and CDHPs, and the numbers may vary between these two types of plans. Employees’ share went down, from 20% to 18%. Cost-sharing for families, as well as in-network deductibles and in-network out-of-pocket costs, remained the same (Figure 4.4).
Pharmacy Plan Design
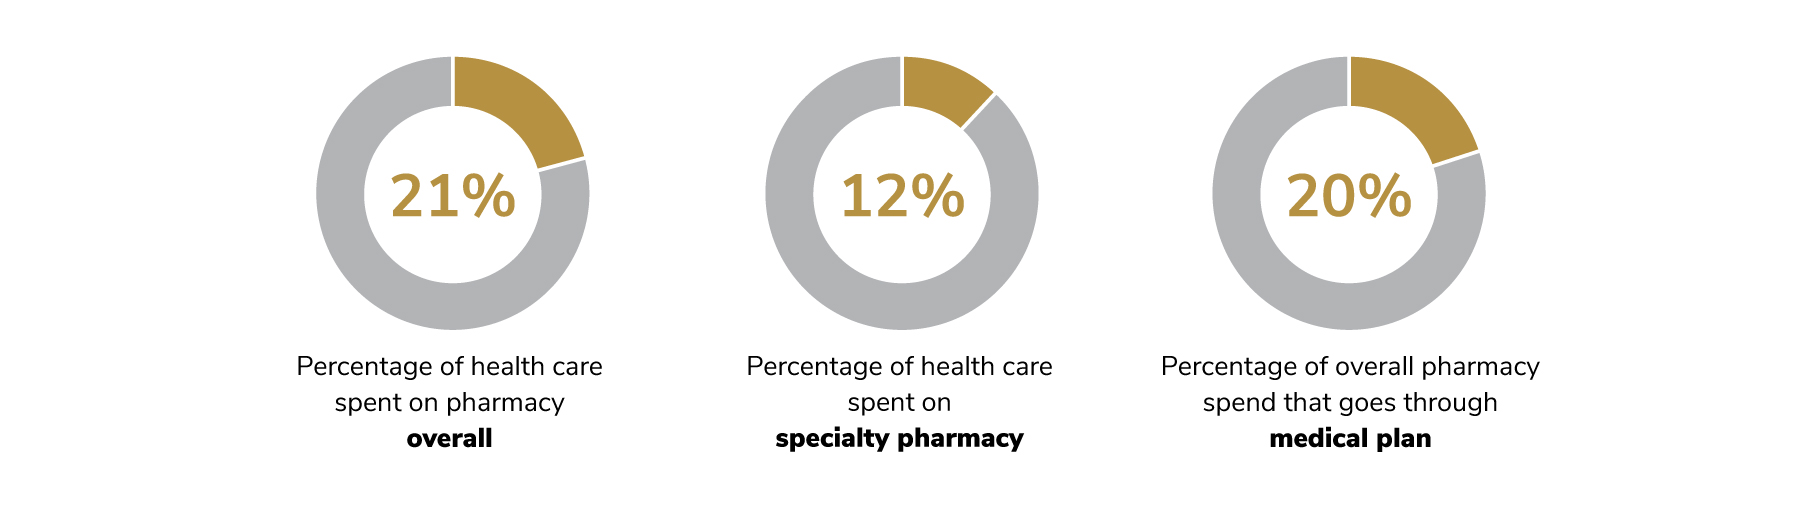
Prescription drug costs continue to be a major concern for employers. Total health care cost attributed to pharmacy spend went up slightly between 2020 and 2021, increasing from 20% to 21%. As was found in 2020, specialty pharmacy alone made up 12% of overall health care spend. This amounts to over 50% of an employers’ drug spend dedicated to specialty pharmacy - illustrating the immense role specialty drugs play in employers’ overall health care cost strategy.
For the first time, employers were asked what percentage of overall pharmacy spend goes through the medical plan, an increasingly urgent area of focus due to the increased level of cost share paid through the medical plan. Employers reported that 20% of overall pharmacy spend goes through the medical plan (Figure 4.5).
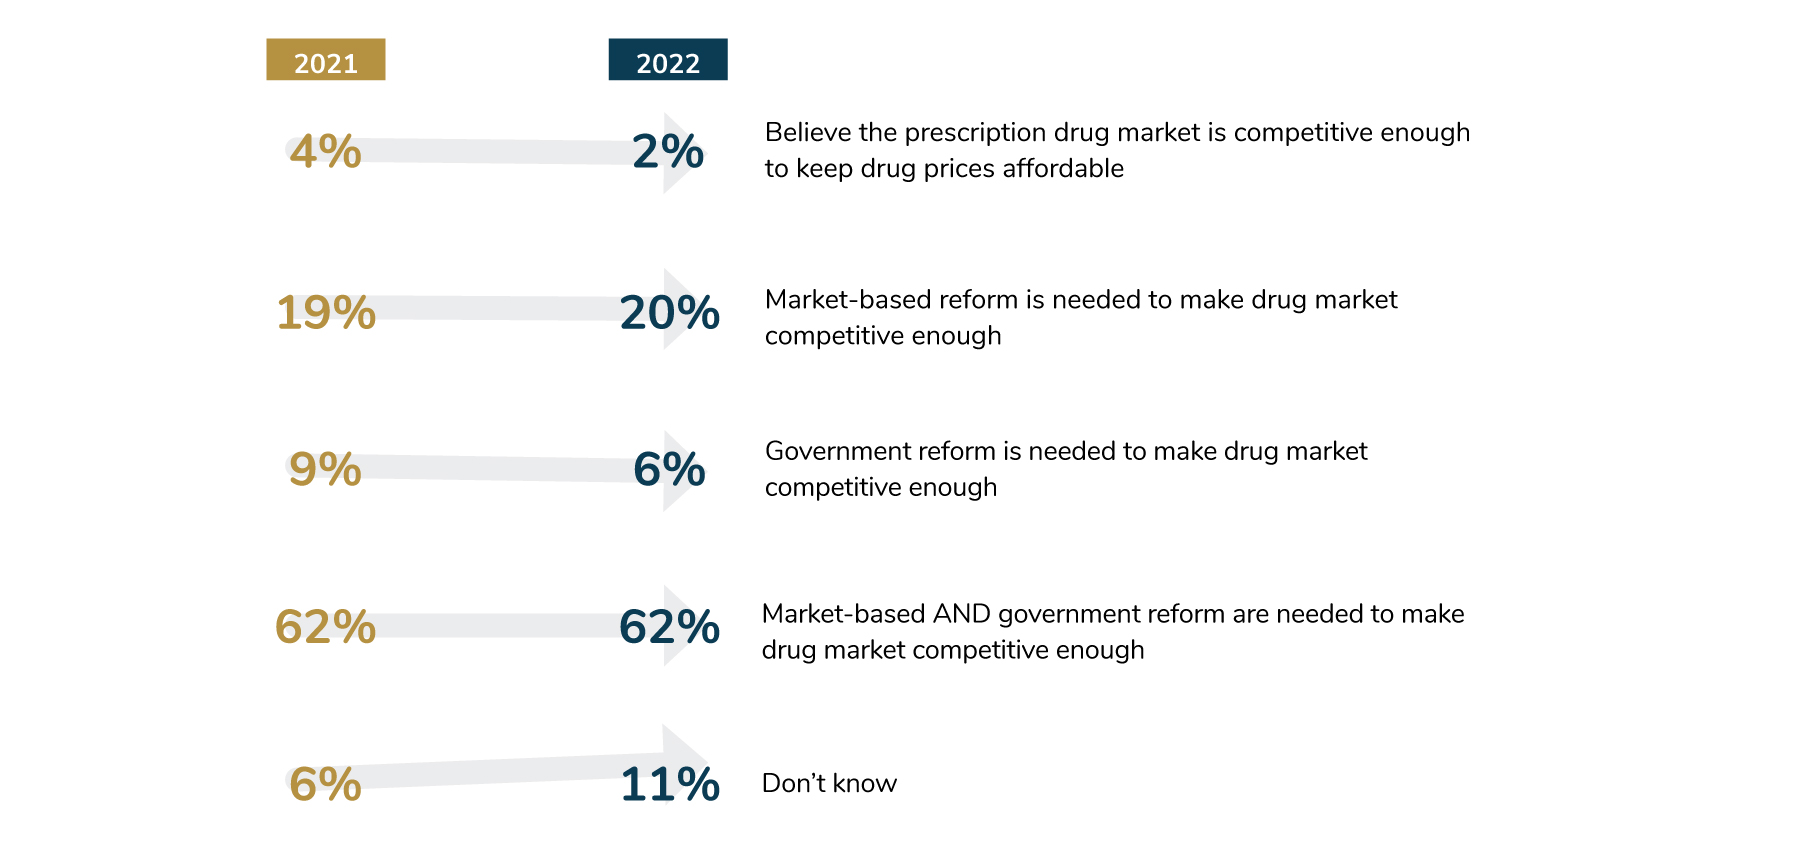
As prices continue to rise, most employers—87%—think that competition within the prescription drug market is needed in order to keep prices affordable. To accomplish this goal, 62% of employers believe that a combination of market-based and government solutions is needed, the same number as in the prior year (Figure 4.6).
Prescription Drug Costs a Major Concern, Yet Opportunities Remain
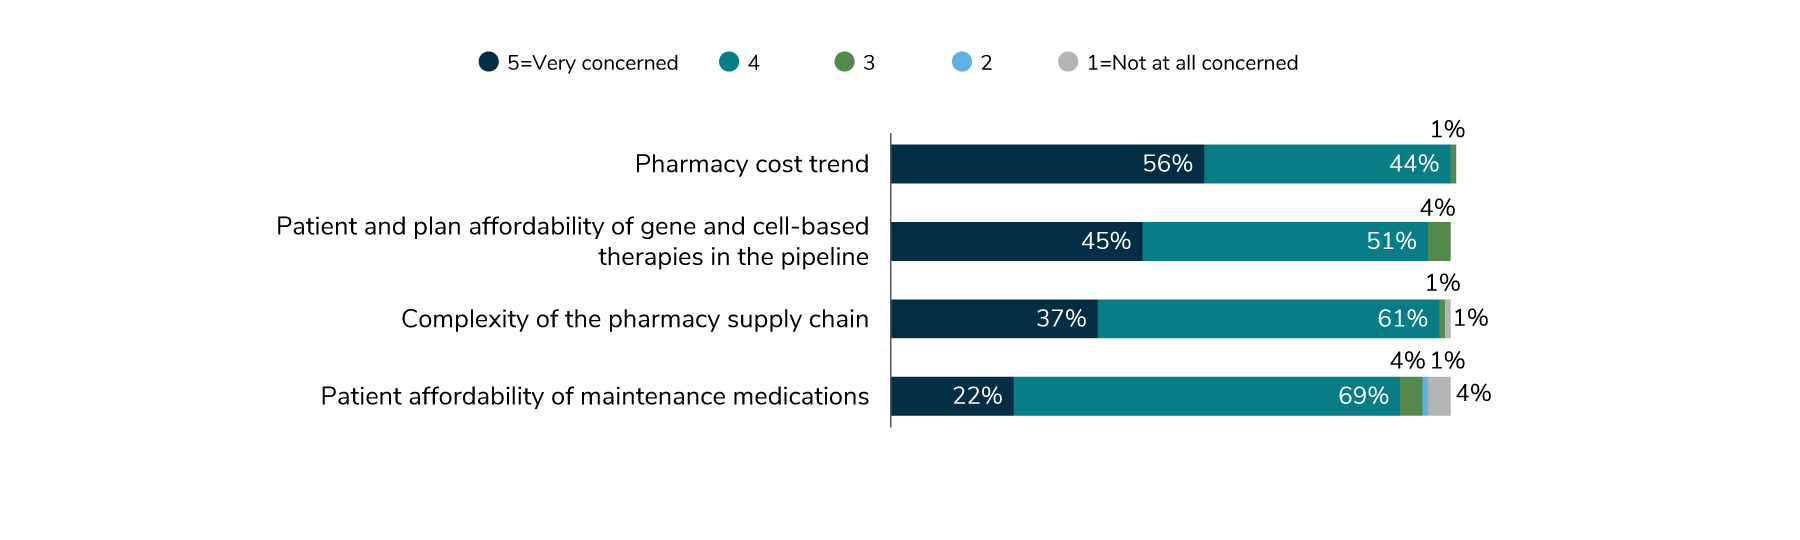
When employers were asked about their major pharmacy concerns, cost topped the list. Overall pharmacy trend, as well as patient affordability for maintenance medications and specialty drugs, are all part of the cost problem (Figure 4.7).
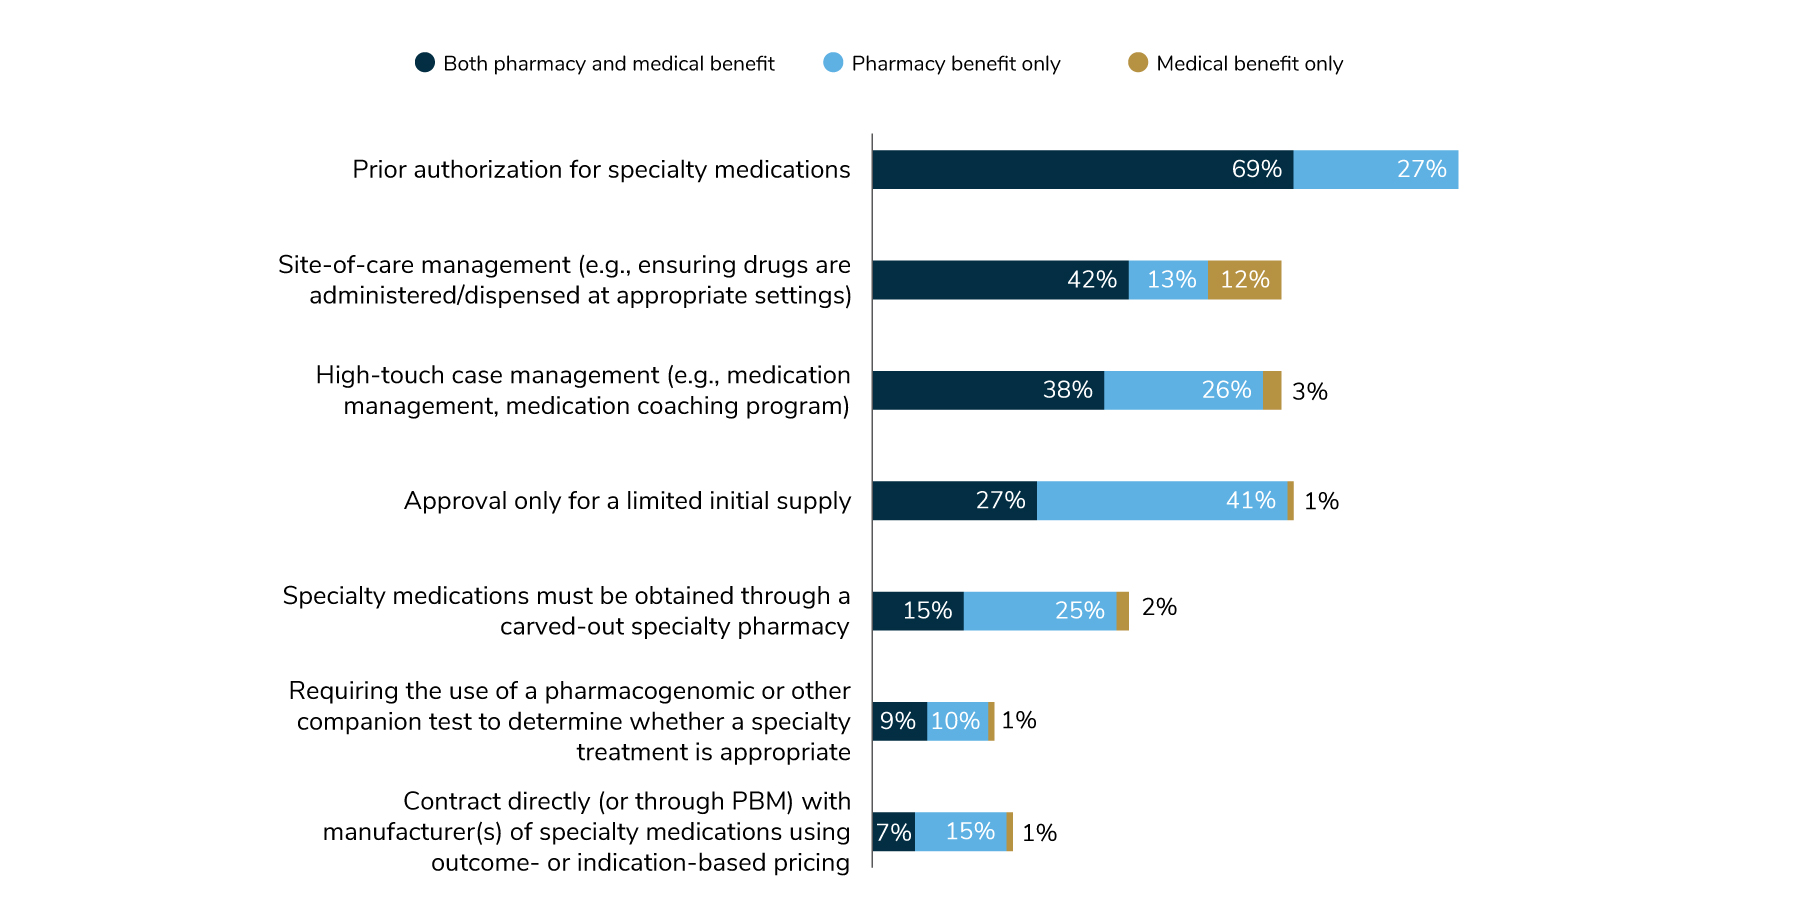
Employers are aware of tactics that can help control costs in the areas of specialty pharmacy and high-cost therapy. For example, two approaches to manage specialty medications—prior authorization and site-of-care management—are gaining traction. Ninety-six percent of employers use prior authorization (whether the claim goes through the pharmacy or medical benefit), while 67% use site-of-care management strategies. However, there are other cost-saving tactics (Figure 4.8) that have not been widely deployed and may be good options for employers to consider in the future.
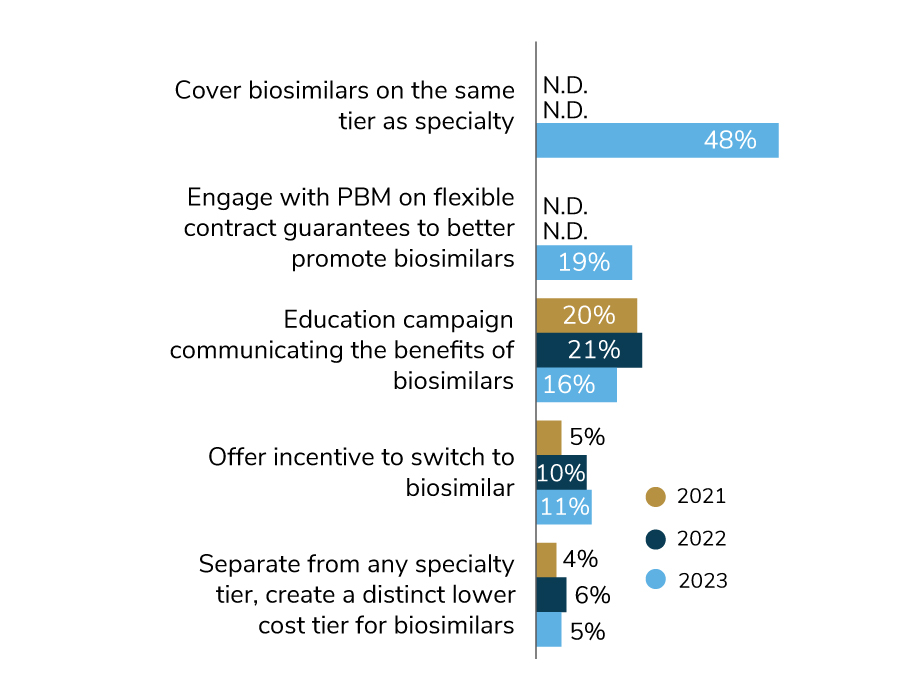
Biosimilars, which are lower-cost alternatives to some specialty drugs like those to treat cancer, are now covered more widely than they were in previous years. In 2023, nearly half (48%) will place biosimilars on the same tier as specialty drugs. A future opportunity for employers is to consider putting biosimilars on a lower tier as a more cost-effective option. For 2023, another cost-saving approach that employers are exploring is engaging with their PBM to help better promote biosimilars (Figure 4.9).
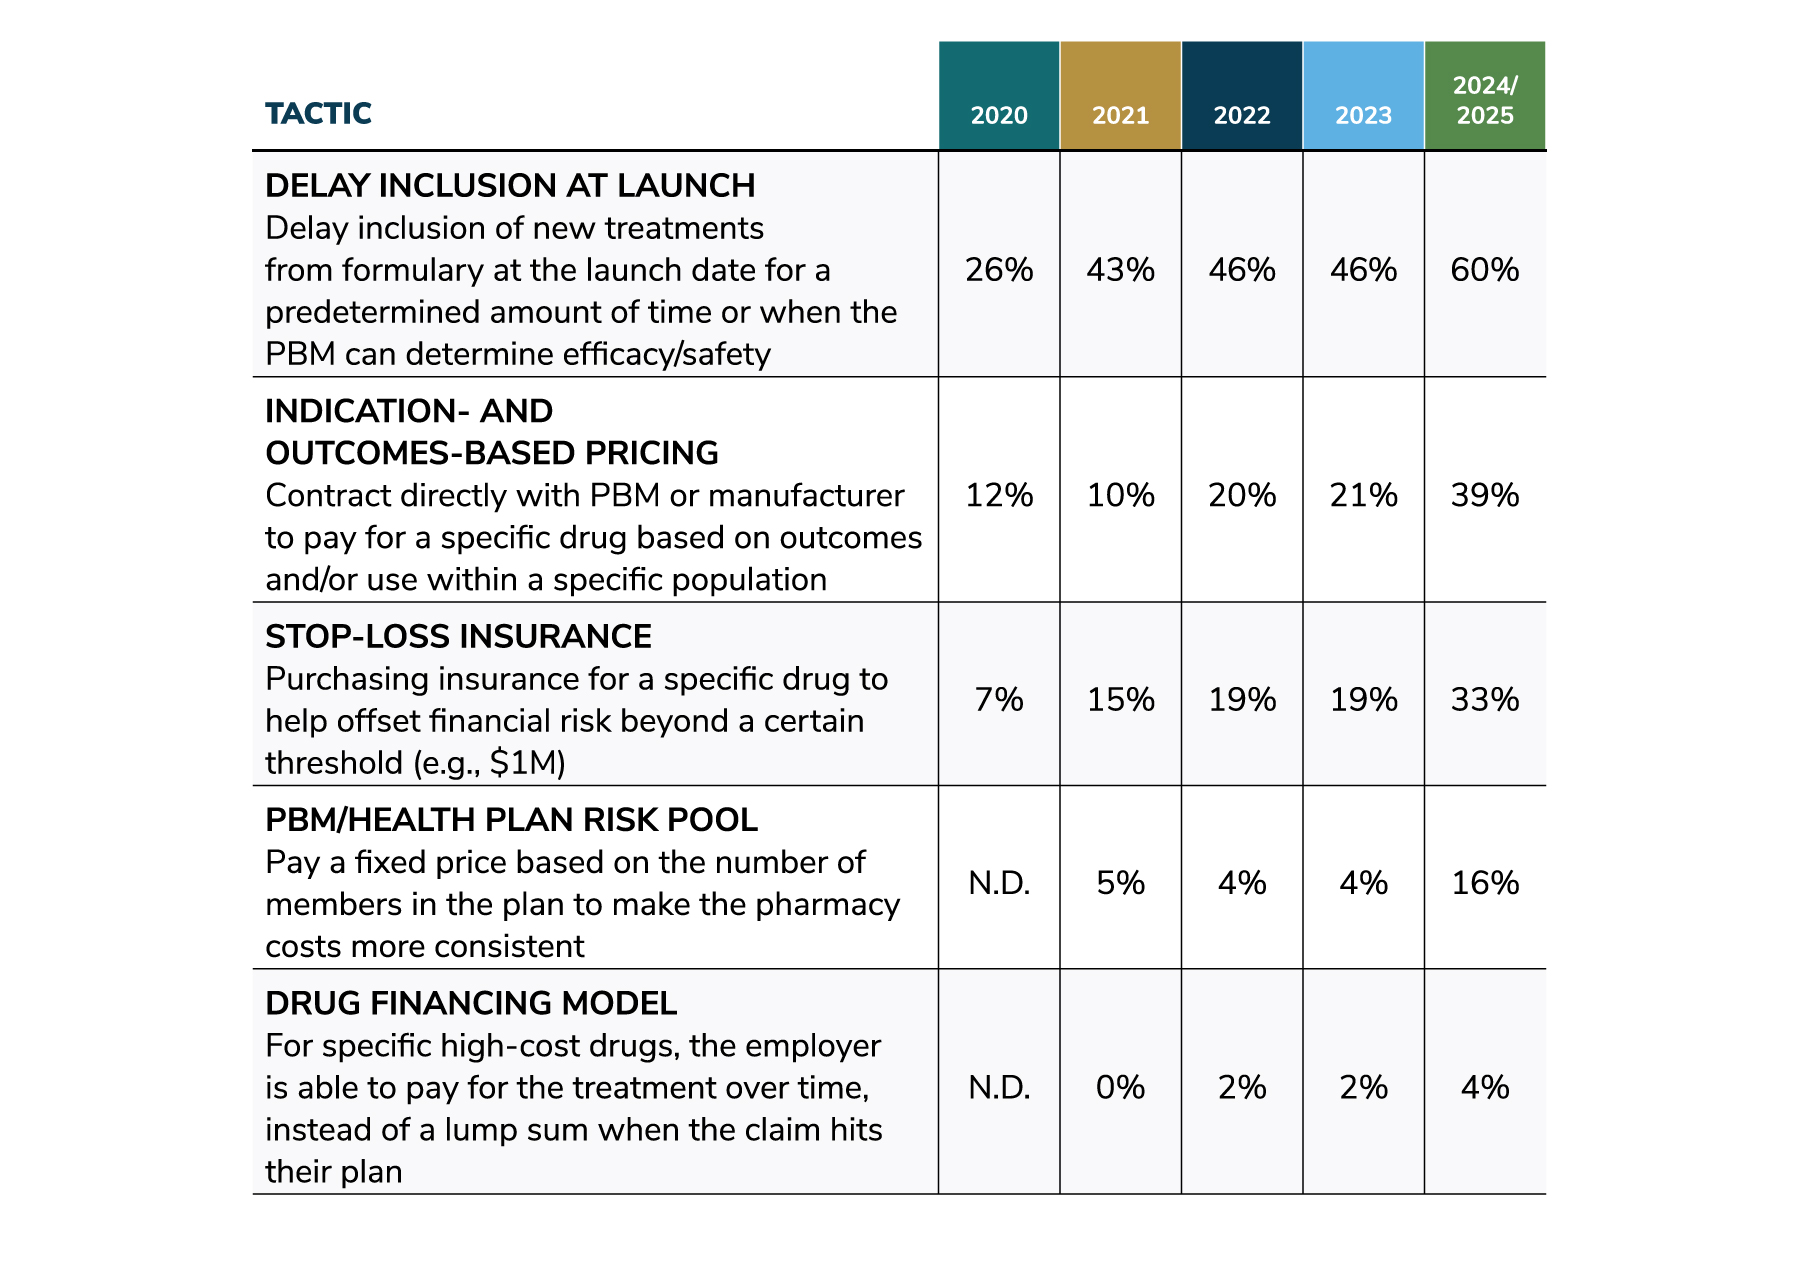
Utilization of cost-saving tactics for high-cost therapies is projected to continue to grow through 2025. By then, the number of such therapies on the market will be significantly higher, making these strategies increasingly impactful. For example, the use of the tactic to delay inclusion at launch so that the PBM can determine safety and efficacy has increased steadily since 2020, rising from 26% to 46% for 2023 to 60% projected in 2024/2025. Other tactics follow a similar upward trajectory (Figure 4.10).
Shifting Away From the Rebate Model
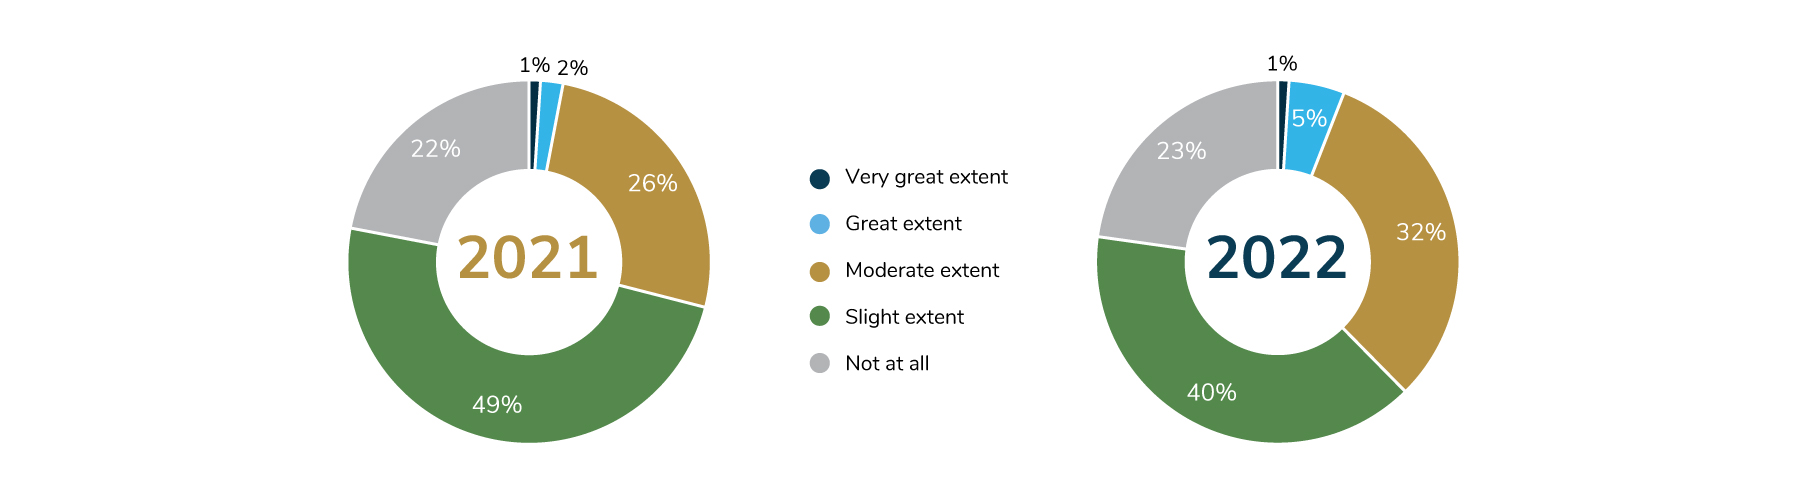
Although employers have long expressed a desire to improve upon the rebate model, little progress has been made in this area. Alternative pricing models are based on the net price of medications (i.e., list price minus rebates, discounts and fees) and emphasize transparency. In 2022, 40% of employers noticed “slight” industry progress in creating alternatives to the rebate status quo, down from 49% in 2021. Another 32% reported “moderate” progress, an increase from the 26% noted last year. But 23% of employers said that no real progress has been made, about the same number reported in 2021 (Figure 4.11).
Numerous barriers stand in the way of reducing the impact of rebates on pharmacy contracting and gross-to-net price. Many stakeholders benefit from the rebates, decreasing the motivation to make significant changes. Nonetheless, as the numbers of those making progress have been rising each year, it is likely that employers will look to adopt alternative pricing models in the years to come.
Virtual Pharmacy Solutions and Digital Therapeutics
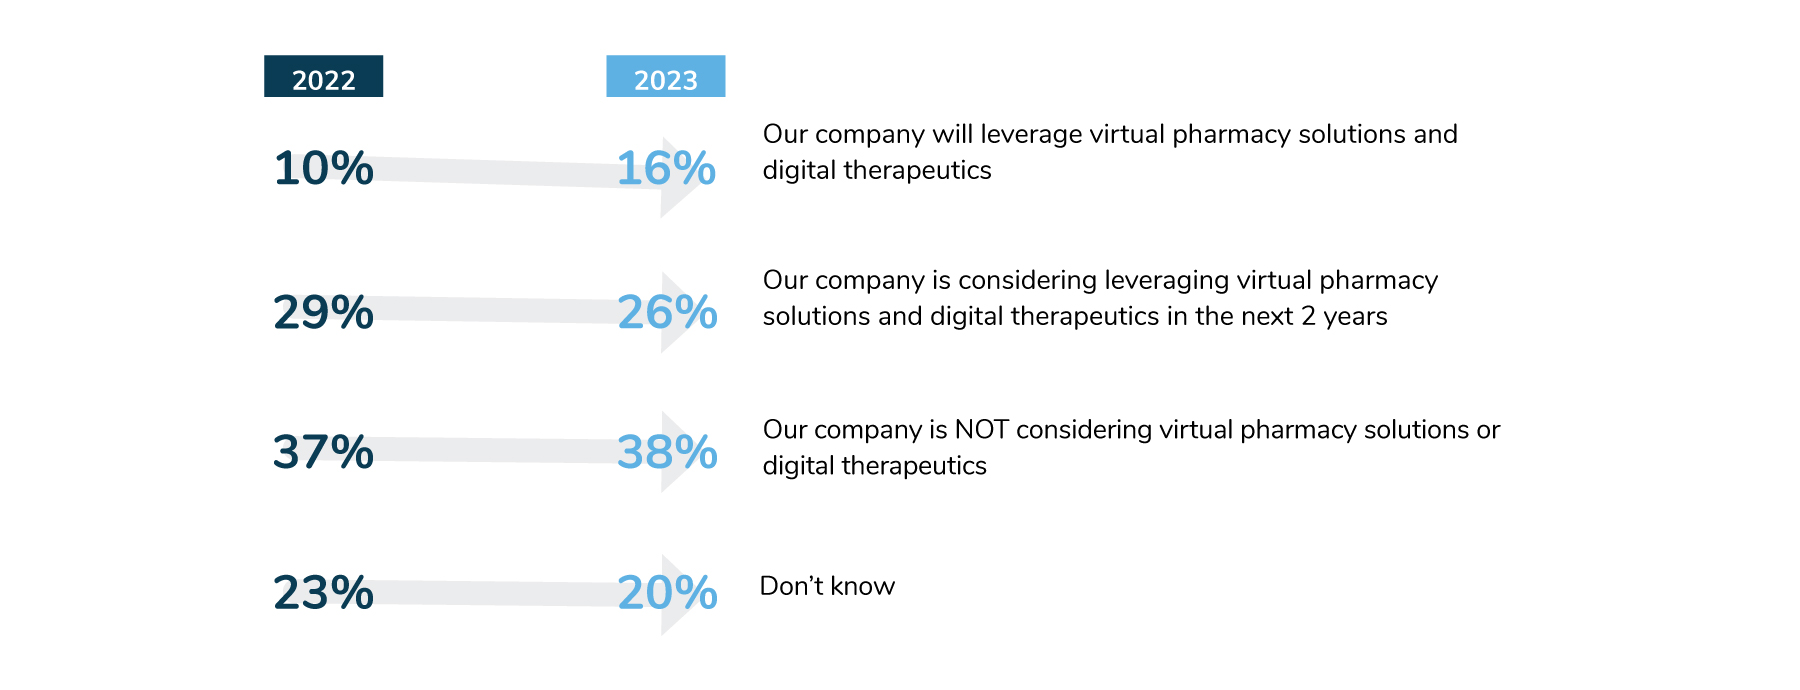
Although virtual health care has increased significantly since the pandemic, the pharmacy space has been slow to catch up, as fewer solutions are available. In 2022, only 10% of employers plan to leverage virtual pharmacy solutions and digital therapeutics, while 16% plan to do so in 2023. But the number of employers considering implementing these solutions declined from 2022’s level of 29% to 26% (Figure 4.12). Since these approaches are relatively new, employers may be unclear what benefits virtual pharmacy solutions can deliver and how they differ from what the traditional PBM may offer.
Digital therapeutics: Software programs or apps that physicians can prescribe as stand-alone or in combination with pharmacotherapy treatment.
Virtual pharmacy solutions: Remote provision of certain prescriptions (e.g., contraceptives) via a web-based platform and/or smartphone application.
Evolving Role of the PBM
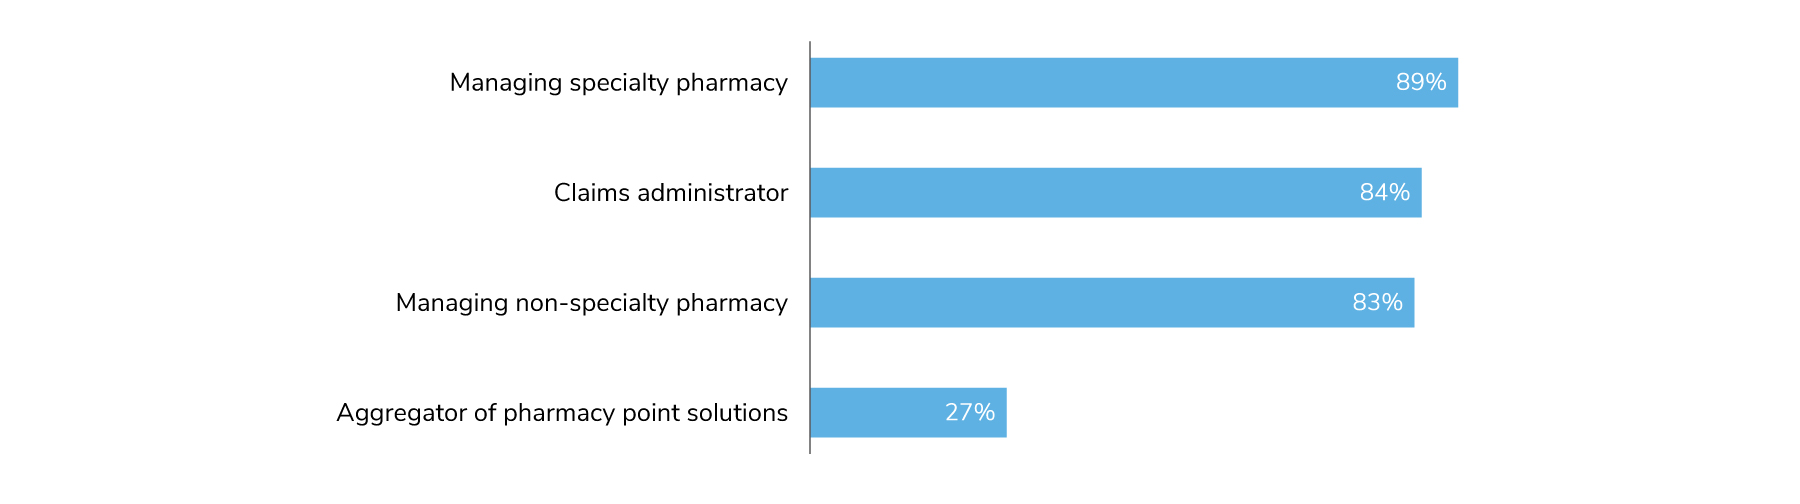
Although most employers will continue to rely on their PBMs to manage both traditional and specialty pharmacy, there are signs that employers are changing their views about the role of their PBM partner. For example, 83% of employers will have their PBMs handle non-specialty pharmacy management, and 84% will leverage PBMs for claims management (Figure 4.13). In addition, 27% of employers will rely on their PBMs for point solution aggregation, up from 5% in 2022. This increase may reflect a desire for more streamlined procurement and management of programmatic solutions.
Looking to the Future: Precision Medicine
Precision medicine approaches, including genomic testing and immunotherapy, are already being implemented, and their use is expected to continue to grow. Many employers are already covering some aspects of precision medicine, and more plan to do in the future.
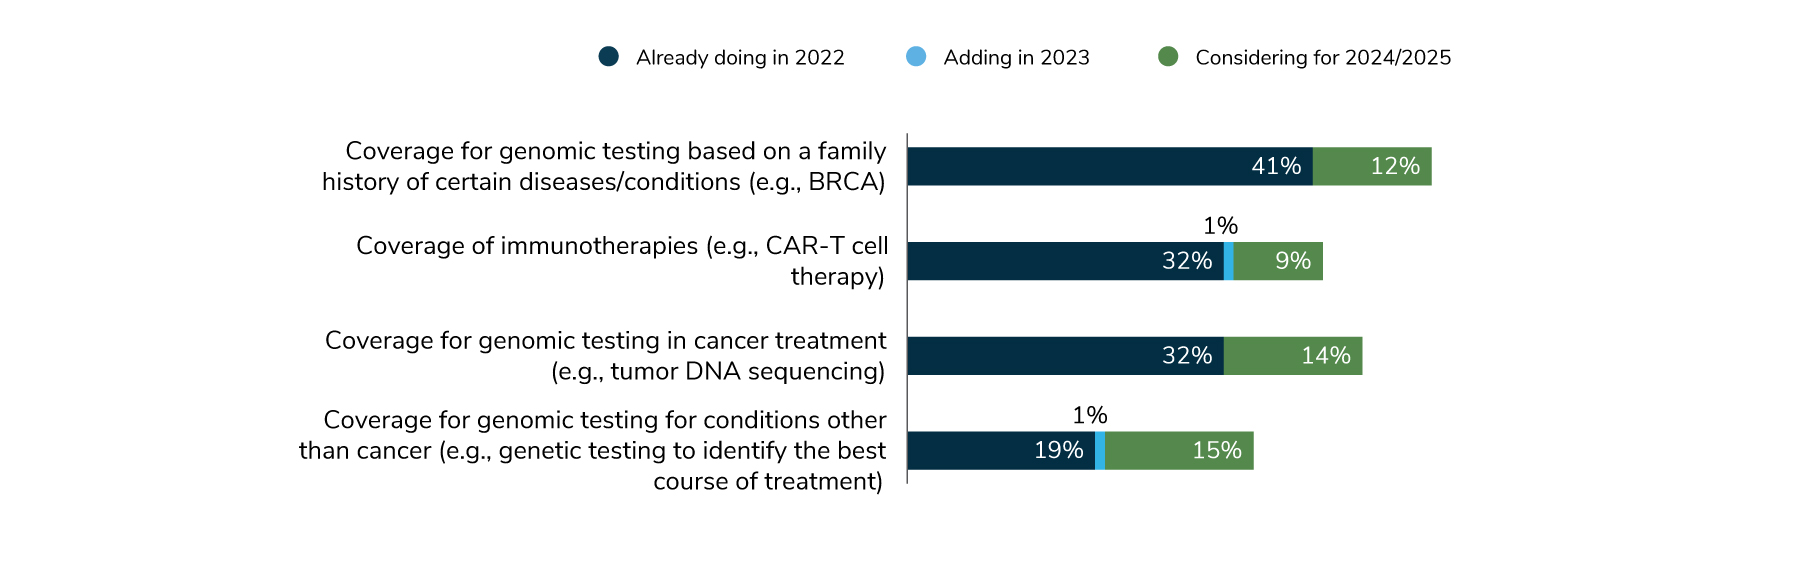
In 2022, 41% of employers are covering genomic testing based on family history, and 12% are considering doing so for 2024-2025. Coverage for immunotherapy and genomic therapy during treatment are both at 32%. Nine percent are thinking about covering immunotherapy in 2024-2025, and 14% are considering covering genomic testing during cancer treatment (Figure 4.14). These types of therapies represent the future of health care, and no doubt employers will be keeping an eye on them as they consider future plan offerings.

Part 4: Health and Pharmacy Plan Design
-
Introduction2023 Large Employers’ Health Care Strategy and Plan Design Survey

-
Full Report2023 Large Employers’ Health Care Strategy Survey: Full Report
-
Executive Summary2023 Large Employers’ Health Care Strategy Survey: Executive Summary
-
Chart Pack2023 Large Employers’ Health Care Strategy Survey: Chart Pack
-
InfographicInfographic: Managing Rising Health Care Costs in 2023
-
Part 12023 Large Employers’ Health Care Strategy Survey: Perspectives on the Evolving Health Care Landscape
-
Part 22023 Large Employers’ Health Care Strategy Survey: Health Equity
-
Part 32023 Large Employers’ Health Care Strategy Survey: The Health Care Delivery System
-
Part 42023 Large Employers’ Health Care Strategy Survey: Health and Pharmacy Plan Design
-
Part 52023 Large Employers’ Health Care Strategy Survey: Health Care Costs and 2023 Priorities
-
InfographicInfographic: Prescription Costs and Pharmacy Benefits
-
InfographicInfographic: Cancer - Improve Quality, Reduce Costs
More Topics
Articles & Guides
This content is for members only. Already a member?
Login
![]()